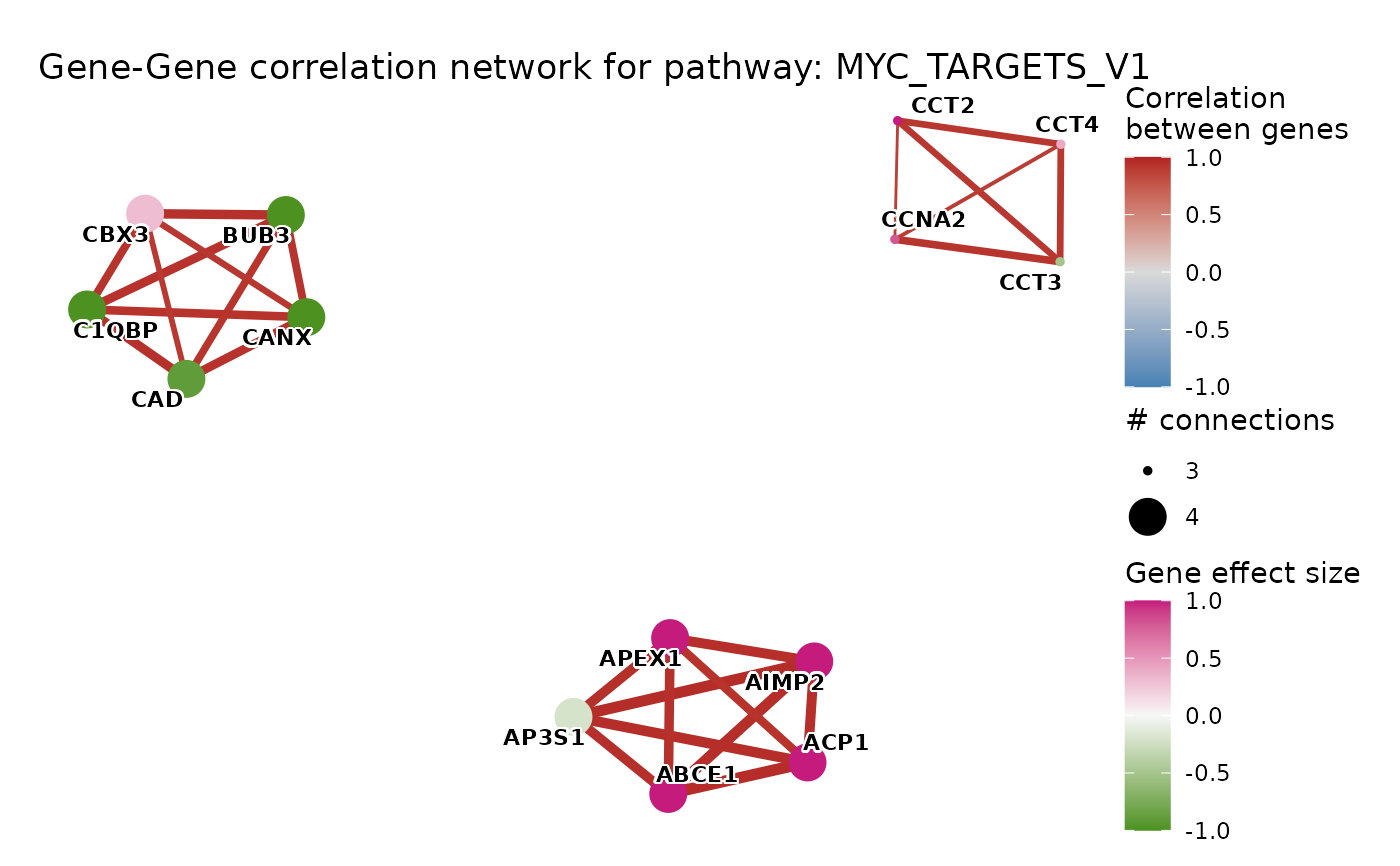
Gene–Gene correlation network for a single pathway
Source:R/plot_pathway_correlation_network.R
plot_pathway_correlation_network.RdComputes pairwise Pearson correlations among genes belonging to a chosen
pathway and draws the resulting network. Edges are drawn only for gene
pairs whose absolute correlation meets cor_thresh. Node size encodes
degree (number of connections), so hub genes appear larger. Node color
encodes the gene-level statistic supplied via effect_size (e.g. log2 fold
change).
Usage
plot_pathway_correlation_network(
  expr,
  pathway,
  gene_sets,
  effect_size,
  top_n_genes = 30,
  cor_thresh = 0.6,
  cor_low = "steelblue",
  cor_mid = "grey85",
  cor_high = "firebrick",
  color_low = RColorBrewer::brewer.pal(11, "PiYG")[10],
  color_mid = RColorBrewer::brewer.pal(11, "PiYG")[6],
  color_high = RColorBrewer::brewer.pal(11, "PiYG")[2],
  title = sprintf("Gene-Gene correlation network for pathway: %s", pathway),
  gene_label_size = 3,
  label_bold = TRUE,
  show_size_legend = TRUE,
  legend_gene_color_title = "Gene effect size",
  legend_correlation_title = "Correlation\nbetween genes",
  legend_gene_size_title = "# connections",
  plot_margin = c(1, 1, 1, 1),
  seed = 42L
)
Arguments
- expr
matrix Normalised expression matrix with genes as rows and samples as columns.
rownamesmust be gene symbols.- pathway
character(1) Name of the pathway to visualise. Must match a value in the
termcolumn ofgene_sets.- gene_sets
data.frame Two-column data frame with columns
"term"and"gene"mapping pathway names to gene symbols. Typically theterm2geneelement returned byrun_gsea().- effect_size
named numeric vector Gene-level statistics (e.g. log2 fold change, t-statistic) used to color nodes. Names must be gene symbols. Missing genes are treated as 0.
- top_n_genes
integer(1) Before computing correlations, retain only the top
top_n_genesgenes ranked byabs(effect_size). Reduces visual clutter on large pathways. Set toInfto use all pathway genes (default30). Must be a single positive whole number (≥ 1) orInf.- cor_thresh
numeric(1) Minimum absolute Pearson correlation required to draw an edge between two genes (default
0.6). Must be a single finite value in [0, 1].- cor_low
character(1) Edge color for strongly negative correlations (default
"steelblue").- cor_mid
character(1) Edge color at correlation = 0 (default
"grey85").- cor_high
character(1) Edge color for strongly positive correlations (default
"firebrick").- color_low
character(1) Node color for the low end of the effect size scale. Defaults to the 10th color of the
PiYGpalette.- color_mid
character(1) Node color at the midpoint of the scale (default: 6th color of
PiYG). Set toNULLfor a 2-color sequential scale (ggplot2::scale_color_gradient()) instead of the default 3-color diverging scale (ggplot2::scale_color_gradient2()).- color_high
character(1) Node color for the high end of the effect size scale. Defaults to the 2nd color of the
PiYGpalette.- title
character(1) Plot title. Defaults to
"Gene-Gene correlation network for pathway: <pathway>".- gene_label_size
numeric(1) Gene label font size (default
3).- label_bold
logical(1) Whether gene labels are bold (default
TRUE).- show_size_legend
logical(1) Whether to display the node-size legend ("# connections") (default
TRUE).- legend_gene_color_title
character(1) Title for the node color (effect size) legend (default
"Gene effect size").- legend_correlation_title
character(1) Title for the edge color (correlation) legend (default
"Correlation\nbetween genes").- legend_gene_size_title
character(1) Title for the node size (# connections) legend (default
"# connections"). Ignored whenshow_size_legend = FALSE.- plot_margin
numeric vector of length 4 giving the plot margin in lines:
c(top, right, bottom, left)(defaultc(1, 1, 1, 1)). Increase the left/right values if node labels are being clipped at the edges.- seed
integer(1) or
NULL. Random seed used for the Fruchterman-Reingold layout so the graph is drawn the same way each time. The caller's RNG state is saved before the seed is set and fully restored on exit, so using this function does not affect subsequent random operations in the session. PassNULLto skip seeding entirely (default42L).
Value
A ggplot2 object, or NULL (invisibly) when fewer than 3 pathway
genes are present in expr or no gene pairs pass cor_thresh.
Details
Unlike plot_pathways(), which uses network layout to reflect shared
pathway membership, this plot shows actual co-expression structure among
genes within a single pathway.