Plot a Kaplan–Meier curve (with confidence intervals and optional risk table)
using a supplied Surv object. If the grouping variable has exactly two
levels the function fits a Cox model and annotates hazard ratio (95% CI) and
p-value; if more than two groups it displays only the log-rank p-value.
Usage
plot_survival_curves(
  surv_obj,
  data,
  group_var = "met_exercise_guidelines",
  confidence_bands = TRUE,
  line_size = 1,
  time_limits = NULL,
  x_breaks = NULL,
  annotate_y = 0.99,
  annotate_x = NULL,
  x_label = "Time (units??)",
  y_label = NULL,
  title = NULL,
  custom_hr_pvalue_text = NULL,
  type = c("survival", "risk"),
  show_risktable = TRUE,
  risktable_stats = c("n.risk", "cum.event"),
  ristable_text_size = 3.5
)
Arguments
- surv_obj
A
Survobject (can be right-censored or left-truncated).- data
A data frame containing the variables referenced by
surv_objandgroup_var.- group_var
Character, name of the grouping column in
data.- confidence_bands
Logical, if
TRUE(default) display confidence bands- line_size
Numeric, line size for the survival curves (default 1).
- time_limits
Numeric(2), x-axis limits for the plot. If
NULL, sensible limits are estimated from the observed event times.- x_breaks
Numeric vector of x-axis breaks. If
NULL, reasonable breaks are selected automatically.- annotate_y
Numeric, y position for annotation text (default 0.99).
- annotate_x
Numeric or
NULL, x position for annotation; ifNULLuses the rightmost value oftime_limits.- x_label
Character, label for the x axis.
- y_label
Character, label for the y axis. If
NULL, a default label is chosen based ontype.- title
Character or
NULL, plot title.- custom_hr_pvalue_text
Character or
NULL; if supplied, overrides the automatically generated HR/log-rank annotation text.- type
Character, one of
"survival"or"risk"; passed toggsurvfit(). If"survival", the default y-axis label is"Probability Event-Free". If"risk", the default y-axis label is"Probability of Event".- show_risktable
Logical; if
TRUE(default), display a risk table beneath the survival curve.- risktable_stats
Character vector specifying statistics shown in the risk table. Must contain one or more of:
c("n.risk", "cum.event", "cum.censor", "n.event", "n.censor"). The default isc("n.risk", "cum.event").- ristable_text_size
Numeric, text size for the risk table (default 3.5).
Available statistics:
"n.risk"Number of patients at risk"cum.event"Cumulative number of observed events"cum.censor"Cumulative number of censored observations"n.event"Number of events in each time interval"n.censor"Number of censored observations in each time interval
Examples
data(cancer, package = "survival")
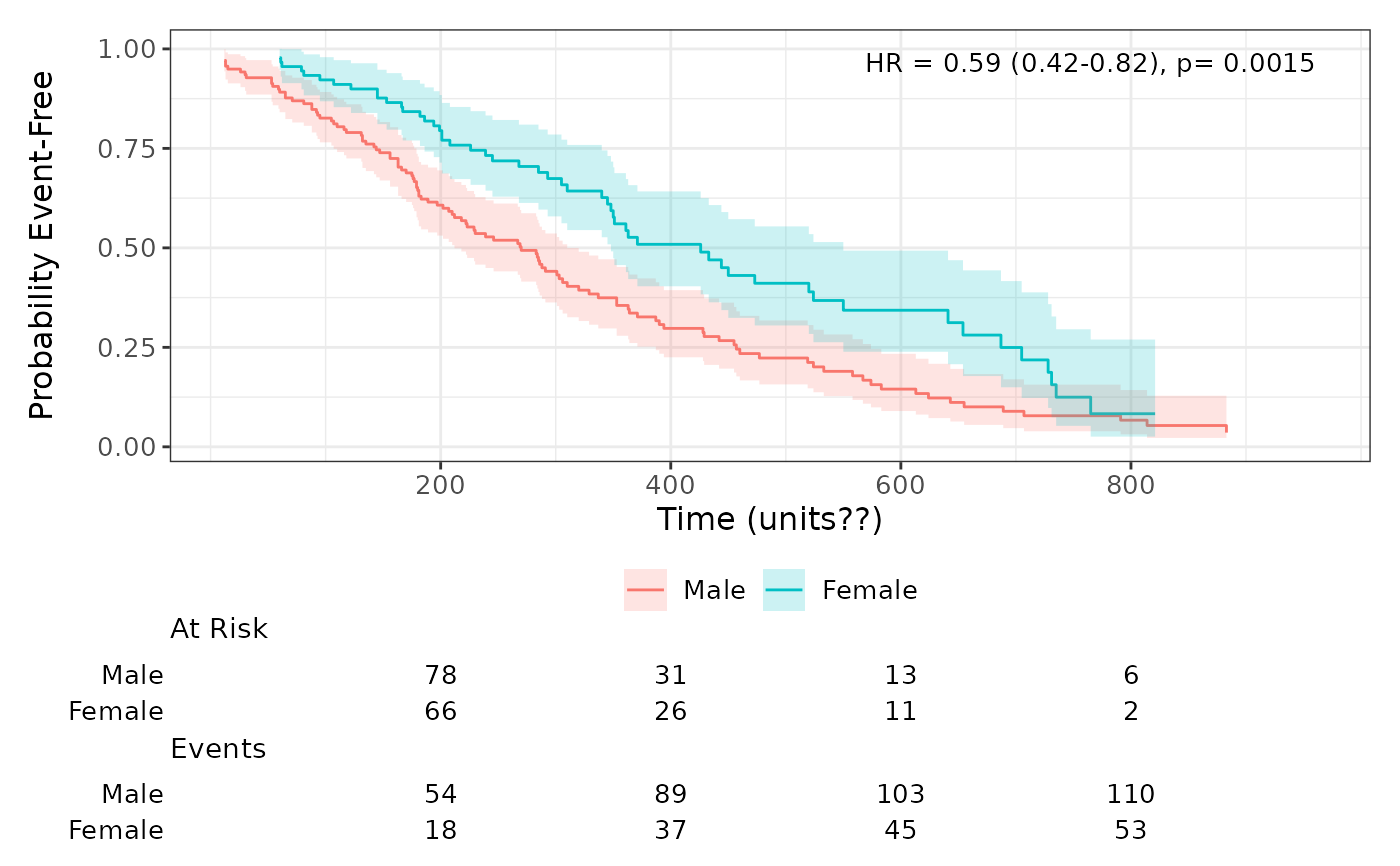
# Example with two groups
lung$sex <- factor(lung$sex, labels = c("Male", "Female"))
surv_obj <- with(lung, survival::Surv(time, status == 2))
plot_survival_curves(
surv_obj,
lung,
group_var = "sex"
) + theme_bw2()
#> Warning: Using `size` aesthetic for lines was deprecated in ggplot2 3.4.0.
#> ℹ Please use `linewidth` instead.
#> ℹ The deprecated feature was likely used in the ggsurvfit package.
#> Please report the issue at <https://github.com/pharmaverse/ggsurvfit/issues>.
 # Hide the risk table
plot_survival_curves(
surv_obj,
lung,
group_var = "sex",
show_risktable = FALSE
) + theme_bw2()
#> Warning: Removed 7 rows containing missing values or values outside the scale range
#> (`geom_step()`).
# Hide the risk table
plot_survival_curves(
surv_obj,
lung,
group_var = "sex",
show_risktable = FALSE
) + theme_bw2()
#> Warning: Removed 7 rows containing missing values or values outside the scale range
#> (`geom_step()`).
 # Show only number at risk
plot_survival_curves(
surv_obj,
lung,
group_var = "sex",
risktable_stats = "n.risk"
) + theme_bw2()
# Show only number at risk
plot_survival_curves(
surv_obj,
lung,
group_var = "sex",
risktable_stats = "n.risk"
) + theme_bw2()
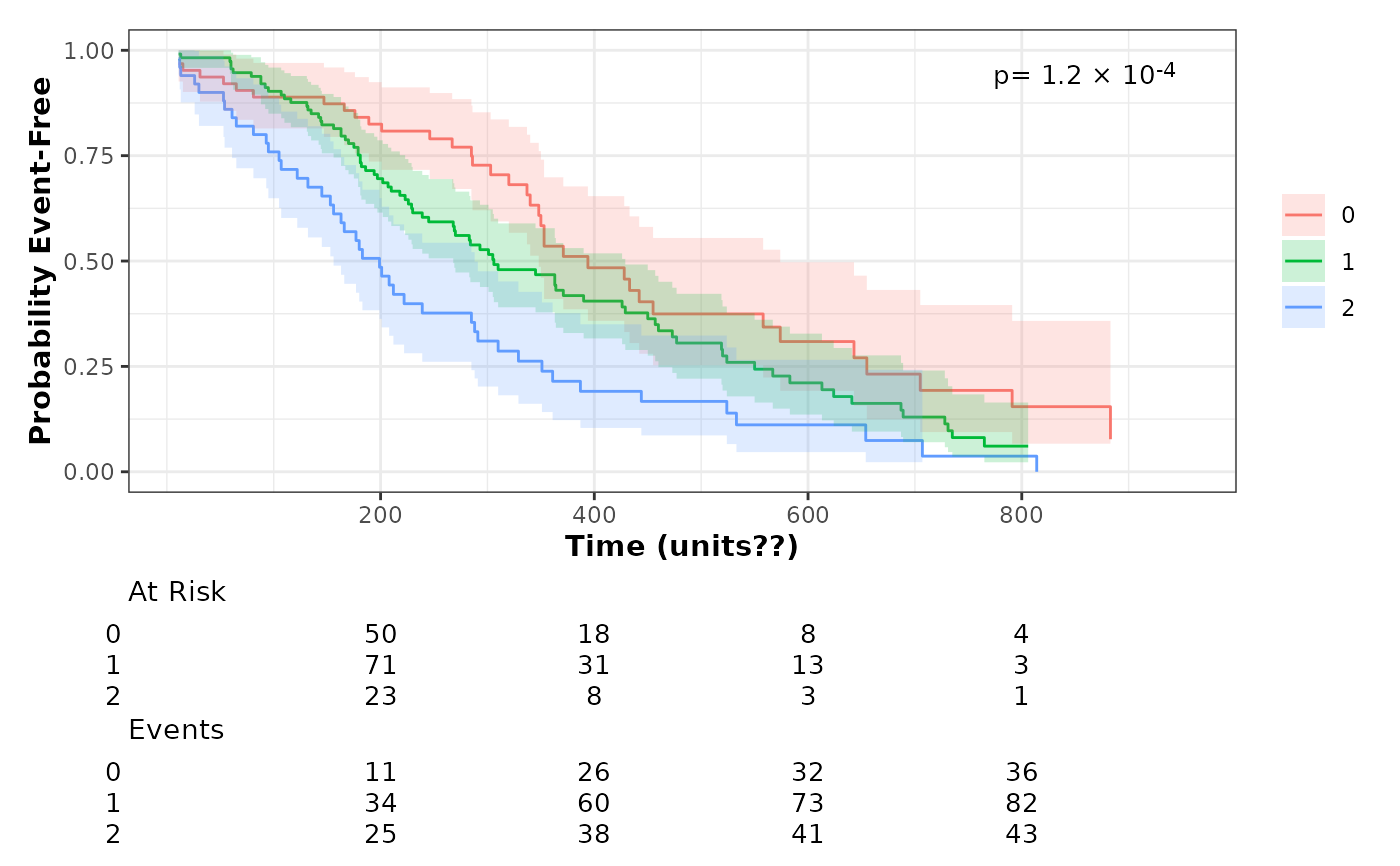
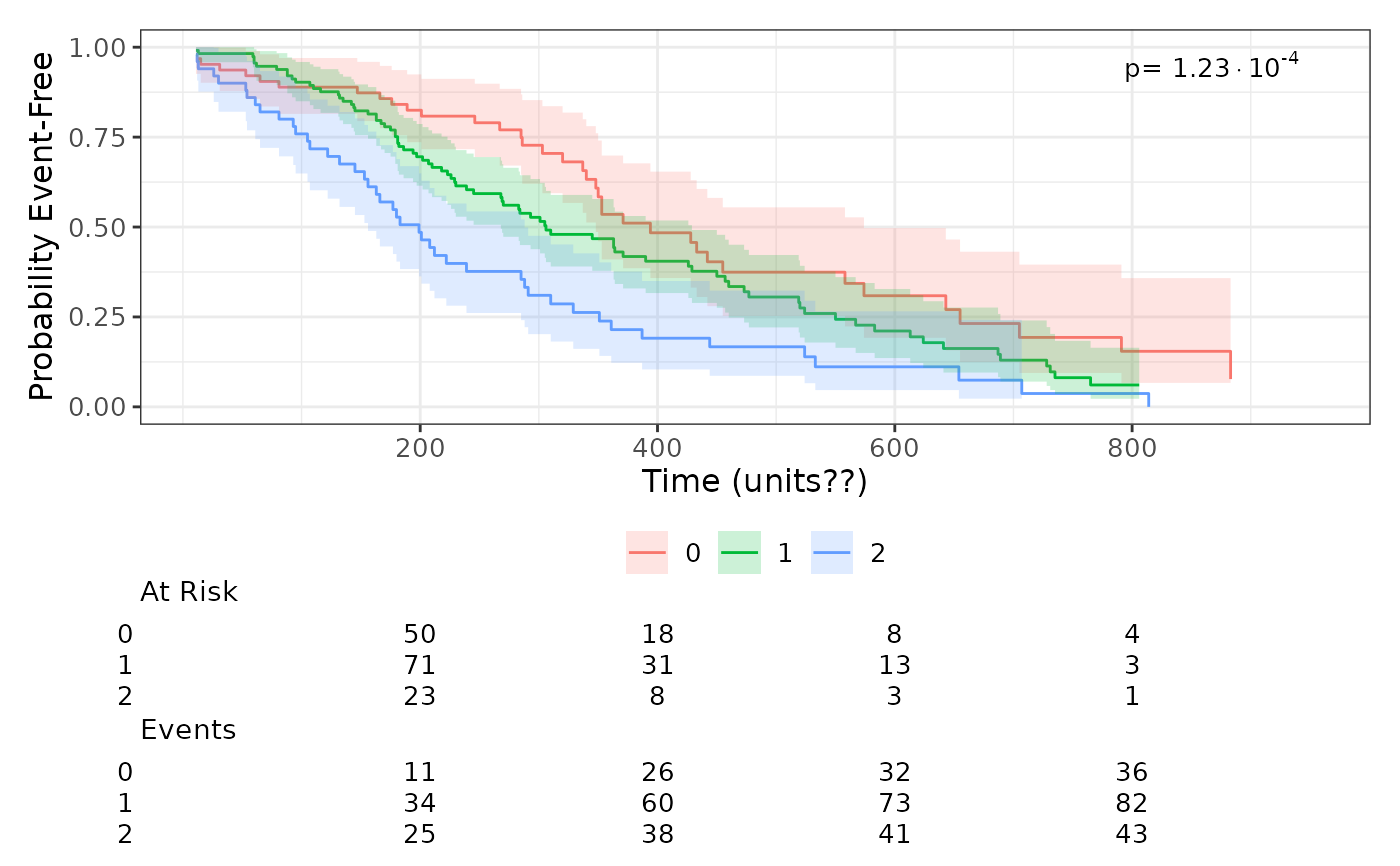 # Example with more than two groups
lung$ph.ecog[lung$ph.ecog == 3] <- NA
lung$ph.ecog <- factor(lung$ph.ecog)
plot_survival_curves(
surv_obj,
lung,
group_var = "ph.ecog"
) + theme_bw2()
# Example with more than two groups
lung$ph.ecog[lung$ph.ecog == 3] <- NA
lung$ph.ecog <- factor(lung$ph.ecog)
plot_survival_curves(
surv_obj,
lung,
group_var = "ph.ecog"
) + theme_bw2()
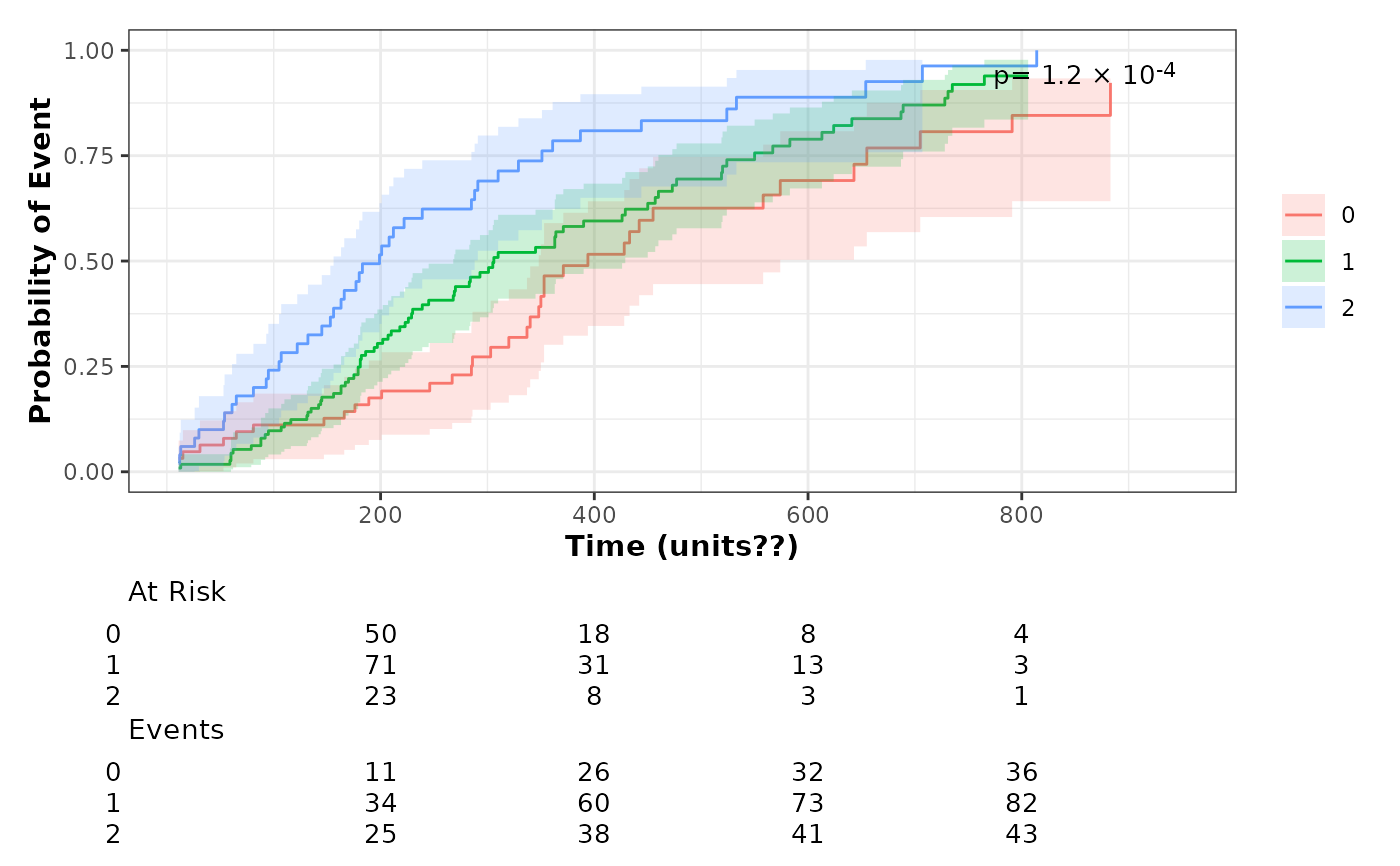
 # Cumulative incidence plot
plot_survival_curves(
surv_obj,
lung,
group_var = "ph.ecog",
type = "risk"
) + theme_bw2()
# Cumulative incidence plot
plot_survival_curves(
surv_obj,
lung,
group_var = "ph.ecog",
type = "risk"
) + theme_bw2()