Converts a tidy (long-format) data frame into a matrix and renders a
Heatmap with optional row/column annotations,
splits, and row scaling.
Usage
plot_heatmap(
  df,
  row_var,
  col_var,
  value_var,
  row_covariates = NULL,
  col_covariates = NULL,
  row_split_var = NULL,
  col_split_var = NULL,
  heatmap_colors = NULL,
  anno_colors = NULL,
  scale_rows = FALSE,
  cluster_rows = TRUE,
  cluster_columns = TRUE,
  show_row_names = TRUE,
  row_names_side = "left",
  show_column_names = TRUE,
  return_details = FALSE,
  heatmap_legend_title = "Value",
  rect_gp = grid::gpar(col = "white", lwd = 1),
  merge_legends = FALSE,
  annotation_legend_param = NULL,
  row_title_gp = grid::gpar(fontface = "bold"),
  column_title_gp = grid::gpar(fontface = "bold"),
  ...
)
Arguments
- df
A data frame in long (tidy) format.
- row_var
<
data-masking> Column indfused as row identifiers.- col_var
<
data-masking> Column indfused as column identifiers.- value_var
<
data-masking> Numeric column indfused as heatmap fill values.- row_covariates
Character vector of column names in
dfto use as row annotations. DefaultNULL.- col_covariates
Character vector of column names in
dfto use as column annotations. DefaultNULL.- row_split_var
Character. Column name in
dfused to split rows. Must have \(\geq 2\) levels. DefaultNULL.- col_split_var
Character. Column name in
dfused to split columns. Must have \(\geq 2\) levels. DefaultNULL.- heatmap_colors
A color mapping passed to
Heatmap'scolargument. DefaultNULL, in which case a numeric color mapping is automatically generated (e.g. viacolorRamp2) rather than using ComplexHeatmap's built-in default.- anno_colors
Named list specifying colors for annotation covariates. For discrete (categorical) covariates, each element should be a named character vector mapping annotation levels to hex colors; any levels not supplied are auto-colored. All levels explicitly named in this vector will appear in the annotation legend, even if they are absent from the current data (useful for maintaining consistent legends across multiple plots from subsetted data). To show only levels present in the data, simply omit the unwanted levels from the named vector. For continuous (numeric) covariates, each element may instead be a function that maps numeric values to colors (e.g., a function created by
circlize::colorRamp2), which will be applied to the numeric annotation values to generate colors. DefaultNULL.- scale_rows
Logical. Whether to z-score scale rows.
- cluster_rows
Logical. Whether to cluster rows. Default
TRUE.- cluster_columns
Logical. Whether to cluster columns. Default
TRUE.- show_row_names
Logical. Default
TRUE.- row_names_side
"left"or"right". Default"left".- show_column_names
Logical. Default
TRUE.- return_details
Logical. If
TRUE, returns a list with the drawn heatmap object, final annotation colors, and levels. DefaultFALSE.- heatmap_legend_title
Character. Title for the heatmap legend
- rect_gp
A grid::gpar object of graphical parameters for heatmap cells (passed through to ComplexHeatmap::Heatmap's
rect_gpargument). Use it to control cell borders and lines (e.g.col,lwd,lty) or fill behavior. Default:grid::gpar(col = "white", lwd = 1). To hide borders userect_gp = grid::gpar(col = NA).- merge_legends
Logical. Controls two related legend behaviors when
TRUE:Deduplication (this wrapper): annotation covariates with semantically equivalent color mappings are collapsed into a single legend whose title is the covariate names joined by
"\n"(e.g."pvalue\nqvalue"); redundant duplicate legends are suppressed. Equivalence is determined by value, not object identity: named character vectors are compared after sorting by name; functions produced bycolorRamp2are compared by their break-points and colors; other function types fall back toidentical().Legend packing (
ComplexHeatmap::draw()): the value is forwarded asmerge_legendstodraw, which packs heatmap and annotation legends into a single combined block rather than separate groups.
Default
FALSEfor backward compatibility.- annotation_legend_param
Named list of legend parameters to customize annotation legend titles and appearance, passed to both column and row annotations via
HeatmapAnnotationandrowAnnotation. Each element should be named after the annotation covariate. For example:list(var1 = list(title = "My Title")). Whenmerge_legends = TRUE, user-provided params override any auto-generated titles from deduplication. DefaultNULL.- row_title_gp
Graphic parameters for row split labels, passed to
Heatmap'srow_title_gpargument. Defaultgrid::gpar(fontface = "bold").- column_title_gp
Graphic parameters for column split labels, passed to
Heatmap'scolumn_title_gpargument. Defaultgrid::gpar(fontface = "bold").- ...
Additional arguments passed to
Heatmap.
Value
Invisibly returns the drawn HeatmapList
object, or a named list with elements ht, final_colors, and
levels when return_details = TRUE.
Examples
ggplot2::theme_set(theme_bw2())
data(ex_data_heatmap)
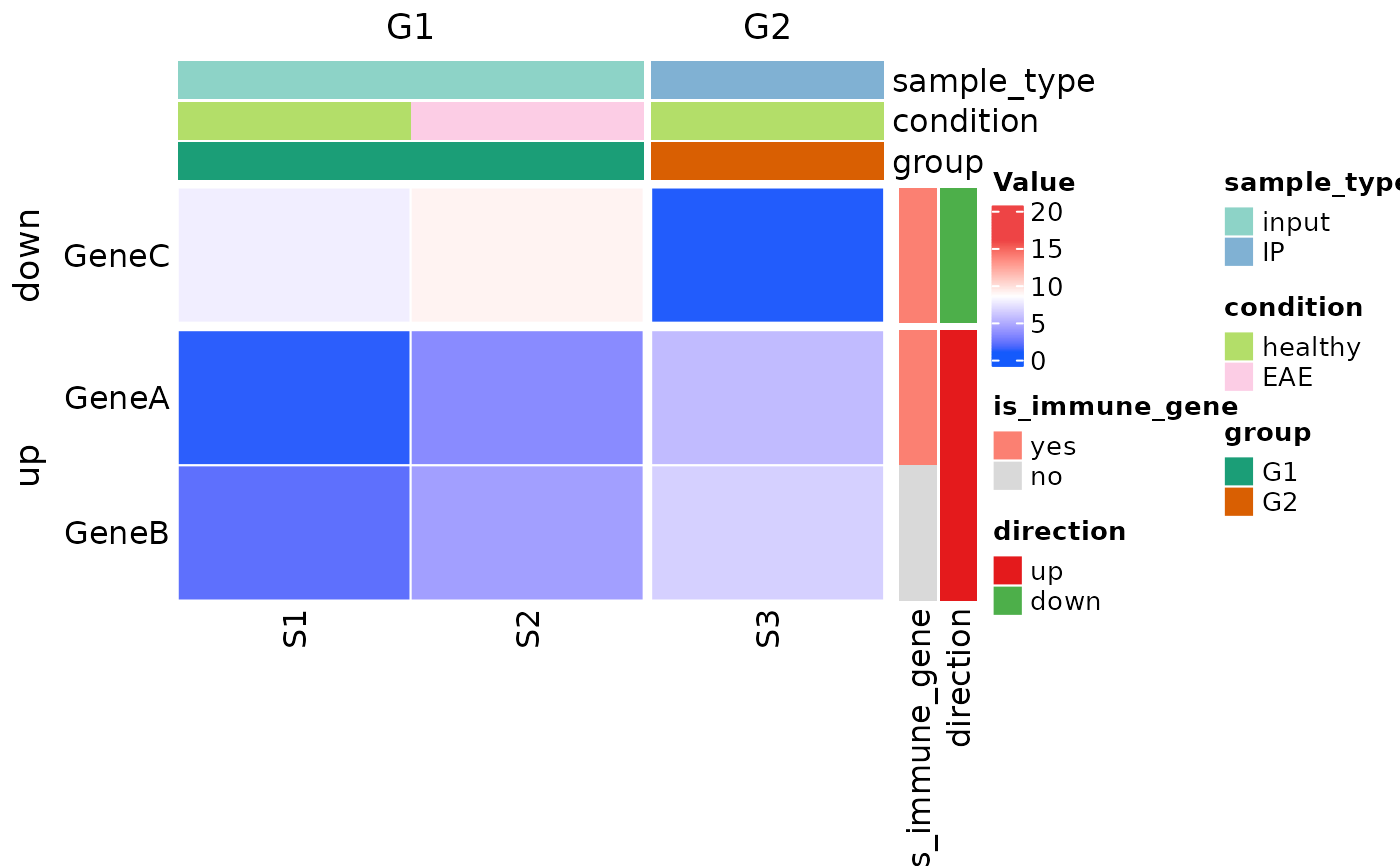
ht_cols_small <- circlize::colorRamp2(
c(min(1:16), mean(1:16), max(1:16)),
c("#145afc", "white", "#ee4445")
)
ann_cols_small <- list(
group = c(G1 = "#1b9e77", G2 = "#d95f02"),
direction = c(up = "#e41a1c", down = "#4daf4a"),
is_immune_gene = c(yes = "#fb8072", no = "#d9d9d9"),
sample_type = c(input = "#8dd3c7", IP = "#80b1d3"),
condition = c(healthy = "#b3de69", EAE = "#fccde5")
)
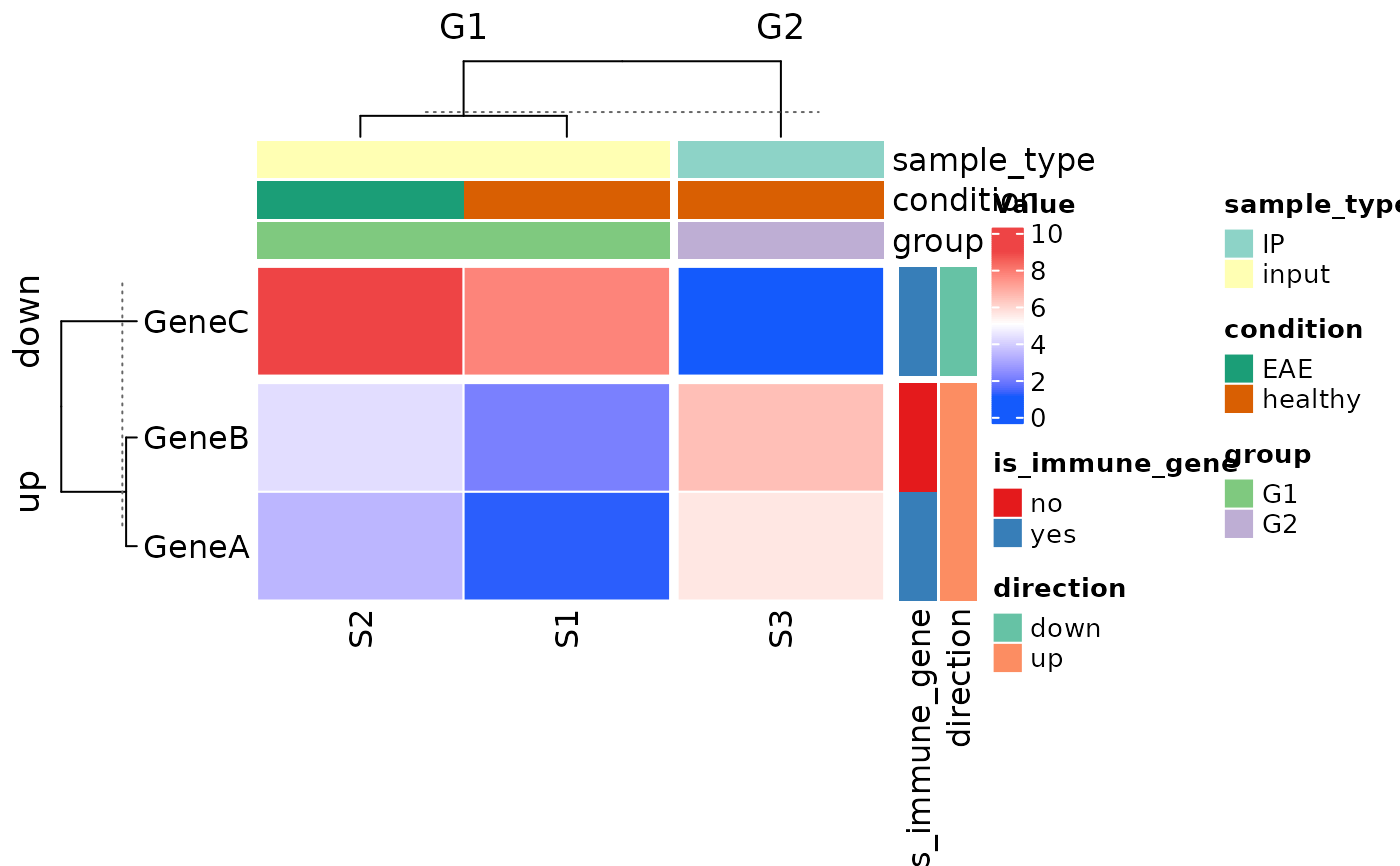
# default colors
plot_heatmap(
df = ex_data_heatmap,
row_var = external_gene_name,
col_var = sample,
value_var = expression,
row_covariates = c("is_immune_gene", "direction"),
col_covariates = c("sample_type", "condition", "group"),
row_split_var = "direction", # up vs down (2 slices)
col_split_var = "group", # G1 vs G2 (2 slices)
scale_rows = FALSE,
cluster_rows = TRUE,
cluster_columns = TRUE,
return_details = TRUE,
row_names_side = "left"
) # row_title_gp and column_title_gp are bold by default
 # custom colors
plot_heatmap(
df = ex_data_heatmap,
row_var = external_gene_name,
col_var = sample,
value_var = expression,
row_covariates = c("is_immune_gene", "direction"),
col_covariates = c("sample_type", "condition", "group"),
row_split_var = "direction",
col_split_var = "group",
scale_rows = FALSE,
cluster_rows = FALSE,
cluster_columns = FALSE,
heatmap_colors = ht_cols_small,
anno_colors = ann_cols_small,
return_details = TRUE
)
# custom colors
plot_heatmap(
df = ex_data_heatmap,
row_var = external_gene_name,
col_var = sample,
value_var = expression,
row_covariates = c("is_immune_gene", "direction"),
col_covariates = c("sample_type", "condition", "group"),
row_split_var = "direction",
col_split_var = "group",
scale_rows = FALSE,
cluster_rows = FALSE,
cluster_columns = FALSE,
heatmap_colors = ht_cols_small,
anno_colors = ann_cols_small,
return_details = TRUE
)
 ### Continuous row and column covariates via colorRamp2 functions
rng_log2fc <- range(ex_data_heatmap$log2fc, na.rm = TRUE)
col_fun_log2fc <- circlize::colorRamp2(
c(rng_log2fc[1], 0, rng_log2fc[2]),
c("#762a83", "white", "#e66101")
)
rng_qc <- range(ex_data_heatmap$qc_score, na.rm = TRUE)
col_fun_qc <- circlize::colorRamp2(
c(rng_qc[1], mean(rng_qc), rng_qc[2]),
c("#ffffcc", "#41b6c4", "#0c2c84")
)
expr_rng <- range(ex_data_heatmap$expression, na.rm = TRUE)
expr_cols <- circlize::colorRamp2(
c(expr_rng[1], mean(expr_rng), expr_rng[2]),
c("#313695", "#f7f7f7", "#a50026")
)
plot_heatmap(
df = ex_data_heatmap,
row_var = external_gene_name,
col_var = sample,
value_var = expression,
row_covariates = c("log2fc", "is_immune_gene", "direction"),
col_covariates = c("qc_score", "condition", "sample_type"),
col_split_var = "group",
row_split_var = "direction",
heatmap_colors = expr_cols,
anno_colors = list(
log2fc = col_fun_log2fc,
qc_score = col_fun_qc,
is_immune_gene = c(yes = "#e7298a", no = "#a6761d"),
direction = c(up = "#1f78b4", down = "#e31a1c"),
condition = c(healthy = "#1b9e77", EAE = "#d95f02"),
sample_type = c(input = "#7570b3", IP = "#66a61e")
),
scale_rows = FALSE,
cluster_rows = TRUE,
cluster_columns = TRUE,
show_row_names = TRUE,
row_names_side = "left",
heatmap_legend_title = "Expression"
)
### Continuous row and column covariates via colorRamp2 functions
rng_log2fc <- range(ex_data_heatmap$log2fc, na.rm = TRUE)
col_fun_log2fc <- circlize::colorRamp2(
c(rng_log2fc[1], 0, rng_log2fc[2]),
c("#762a83", "white", "#e66101")
)
rng_qc <- range(ex_data_heatmap$qc_score, na.rm = TRUE)
col_fun_qc <- circlize::colorRamp2(
c(rng_qc[1], mean(rng_qc), rng_qc[2]),
c("#ffffcc", "#41b6c4", "#0c2c84")
)
expr_rng <- range(ex_data_heatmap$expression, na.rm = TRUE)
expr_cols <- circlize::colorRamp2(
c(expr_rng[1], mean(expr_rng), expr_rng[2]),
c("#313695", "#f7f7f7", "#a50026")
)
plot_heatmap(
df = ex_data_heatmap,
row_var = external_gene_name,
col_var = sample,
value_var = expression,
row_covariates = c("log2fc", "is_immune_gene", "direction"),
col_covariates = c("qc_score", "condition", "sample_type"),
col_split_var = "group",
row_split_var = "direction",
heatmap_colors = expr_cols,
anno_colors = list(
log2fc = col_fun_log2fc,
qc_score = col_fun_qc,
is_immune_gene = c(yes = "#e7298a", no = "#a6761d"),
direction = c(up = "#1f78b4", down = "#e31a1c"),
condition = c(healthy = "#1b9e77", EAE = "#d95f02"),
sample_type = c(input = "#7570b3", IP = "#66a61e")
),
scale_rows = FALSE,
cluster_rows = TRUE,
cluster_columns = TRUE,
show_row_names = TRUE,
row_names_side = "left",
heatmap_legend_title = "Expression"
)
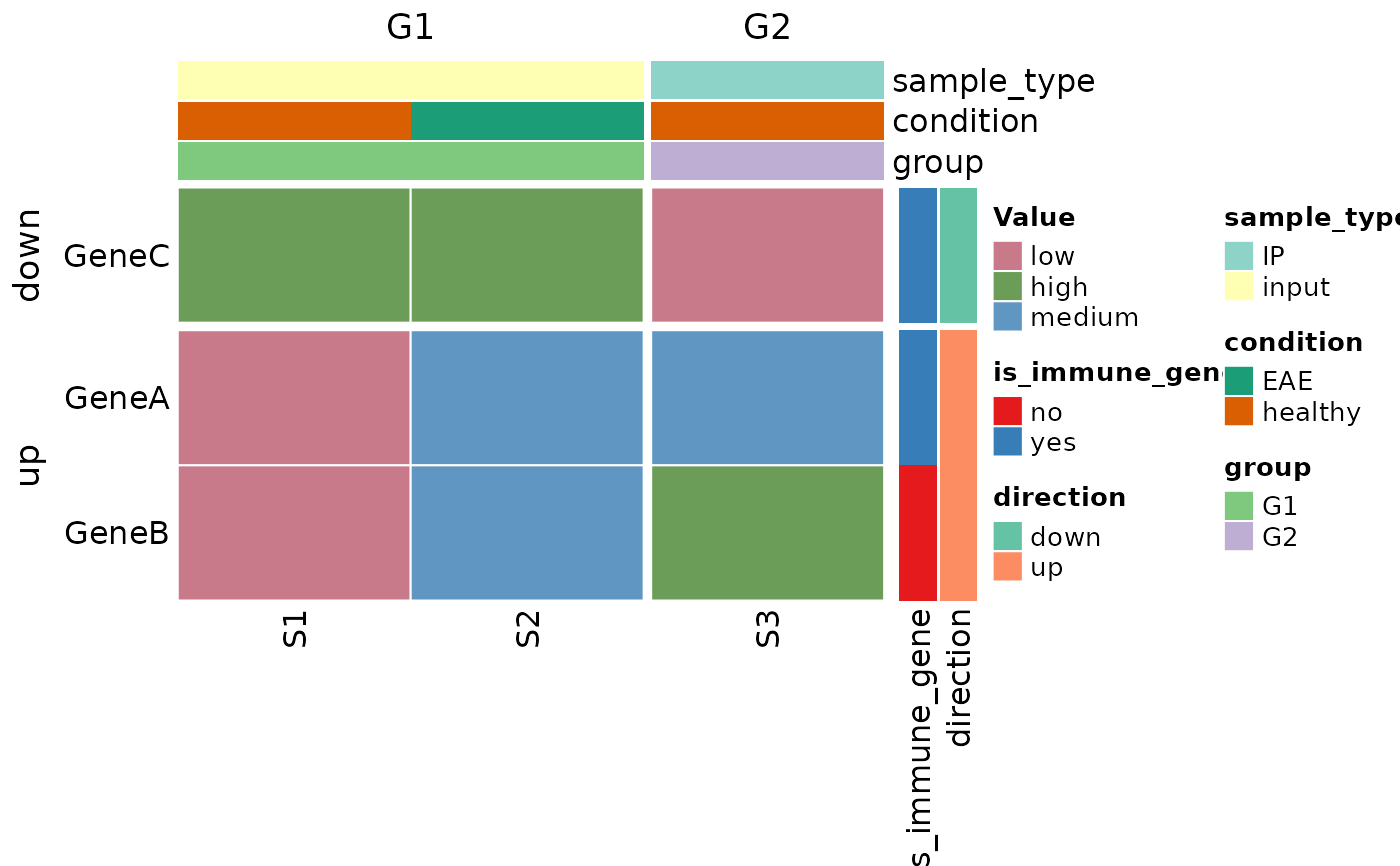
 ##### make a categorical heatmap
cat_data <- ex_data_heatmap
cat_data$expression <- as.character(cut(
cat_data$expression,
breaks = c(-Inf, 3, 6, Inf),
labels = c("low", "medium", "high")
))
# default colors
plot_heatmap(
df = cat_data,
row_var = external_gene_name,
col_var = sample,
value_var = expression,
row_covariates = c("is_immune_gene", "direction"),
col_covariates = c("sample_type", "condition", "group"),
row_split_var = "direction", # up vs down (2 slices)
col_split_var = "group", # G1 vs G2 (2 slices)
scale_rows = FALSE,
cluster_rows = TRUE,
cluster_columns = TRUE,
return_details = TRUE,
row_names_side = "left"
)
##### make a categorical heatmap
cat_data <- ex_data_heatmap
cat_data$expression <- as.character(cut(
cat_data$expression,
breaks = c(-Inf, 3, 6, Inf),
labels = c("low", "medium", "high")
))
# default colors
plot_heatmap(
df = cat_data,
row_var = external_gene_name,
col_var = sample,
value_var = expression,
row_covariates = c("is_immune_gene", "direction"),
col_covariates = c("sample_type", "condition", "group"),
row_split_var = "direction", # up vs down (2 slices)
col_split_var = "group", # G1 vs G2 (2 slices)
scale_rows = FALSE,
cluster_rows = TRUE,
cluster_columns = TRUE,
return_details = TRUE,
row_names_side = "left"
)
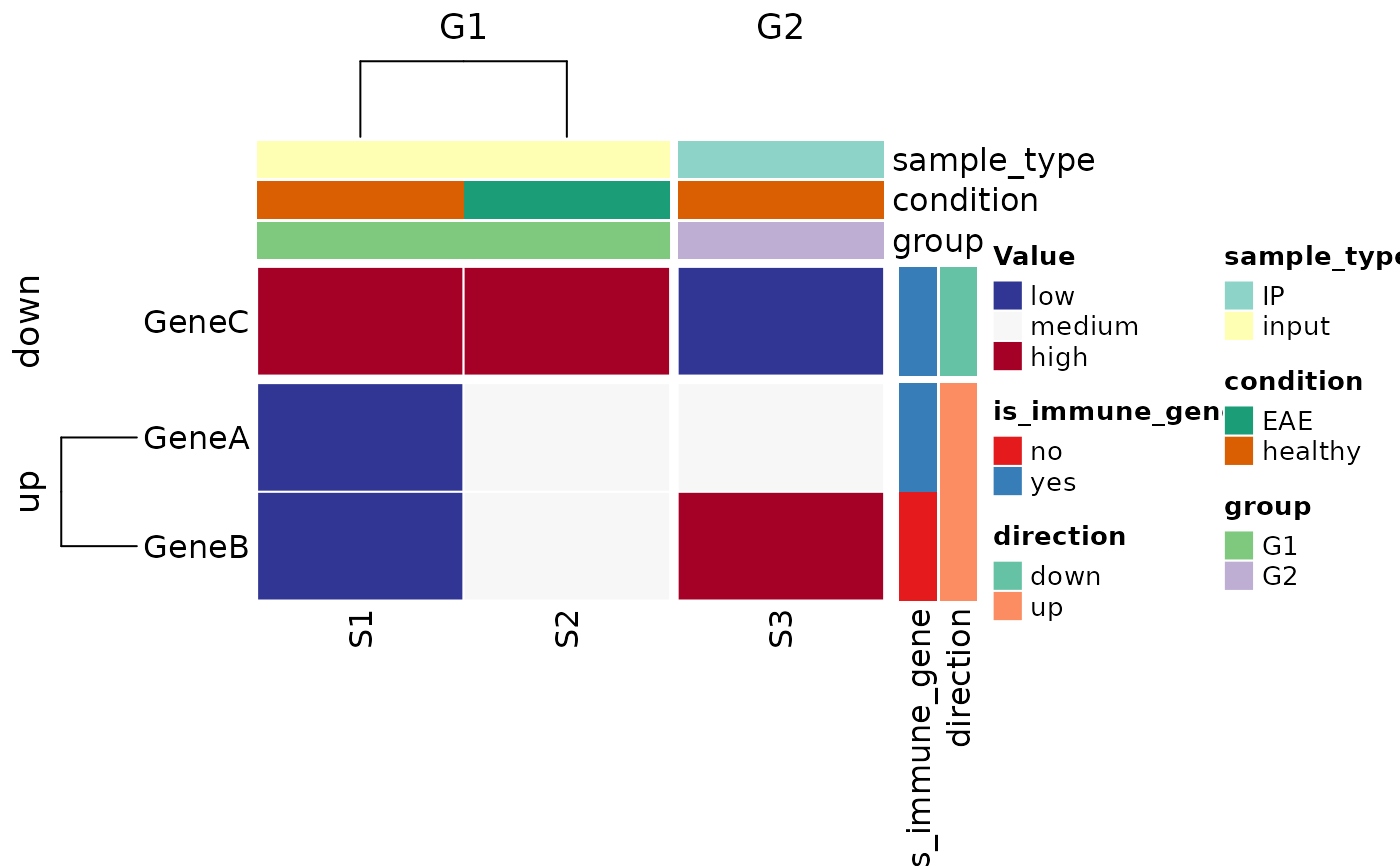
 # custom colors and clustering
heat_cat_colors <- c(
low = "#313695",
medium = "#f7f7f7",
high = "#a50026"
)
clust_dist_gower <- function(x) {
# x is the matrix supplied by Heatmap; convert to factors if needed
df <- as.data.frame(x)
df[] <- lapply(df, factor)
stats::as.dist(cluster::daisy(df, metric = "gower"))
}
plot_heatmap(
df = cat_data,
row_var = external_gene_name,
col_var = sample,
heatmap_colors = heat_cat_colors,
value_var = expression,
row_covariates = c("is_immune_gene", "direction"),
col_covariates = c("sample_type", "condition", "group"),
row_split_var = "direction", # up vs down (2 slices)
col_split_var = "group", # G1 vs G2 (2 slices)
scale_rows = FALSE,
cluster_rows = TRUE,
cluster_columns = TRUE,
return_details = TRUE,
row_names_side = "left",
clustering_distance_rows = clust_dist_gower,
clustering_distance_columns = clust_dist_gower
)
# custom colors and clustering
heat_cat_colors <- c(
low = "#313695",
medium = "#f7f7f7",
high = "#a50026"
)
clust_dist_gower <- function(x) {
# x is the matrix supplied by Heatmap; convert to factors if needed
df <- as.data.frame(x)
df[] <- lapply(df, factor)
stats::as.dist(cluster::daisy(df, metric = "gower"))
}
plot_heatmap(
df = cat_data,
row_var = external_gene_name,
col_var = sample,
heatmap_colors = heat_cat_colors,
value_var = expression,
row_covariates = c("is_immune_gene", "direction"),
col_covariates = c("sample_type", "condition", "group"),
row_split_var = "direction", # up vs down (2 slices)
col_split_var = "group", # G1 vs G2 (2 slices)
scale_rows = FALSE,
cluster_rows = TRUE,
cluster_columns = TRUE,
return_details = TRUE,
row_names_side = "left",
clustering_distance_rows = clust_dist_gower,
clustering_distance_columns = clust_dist_gower
)
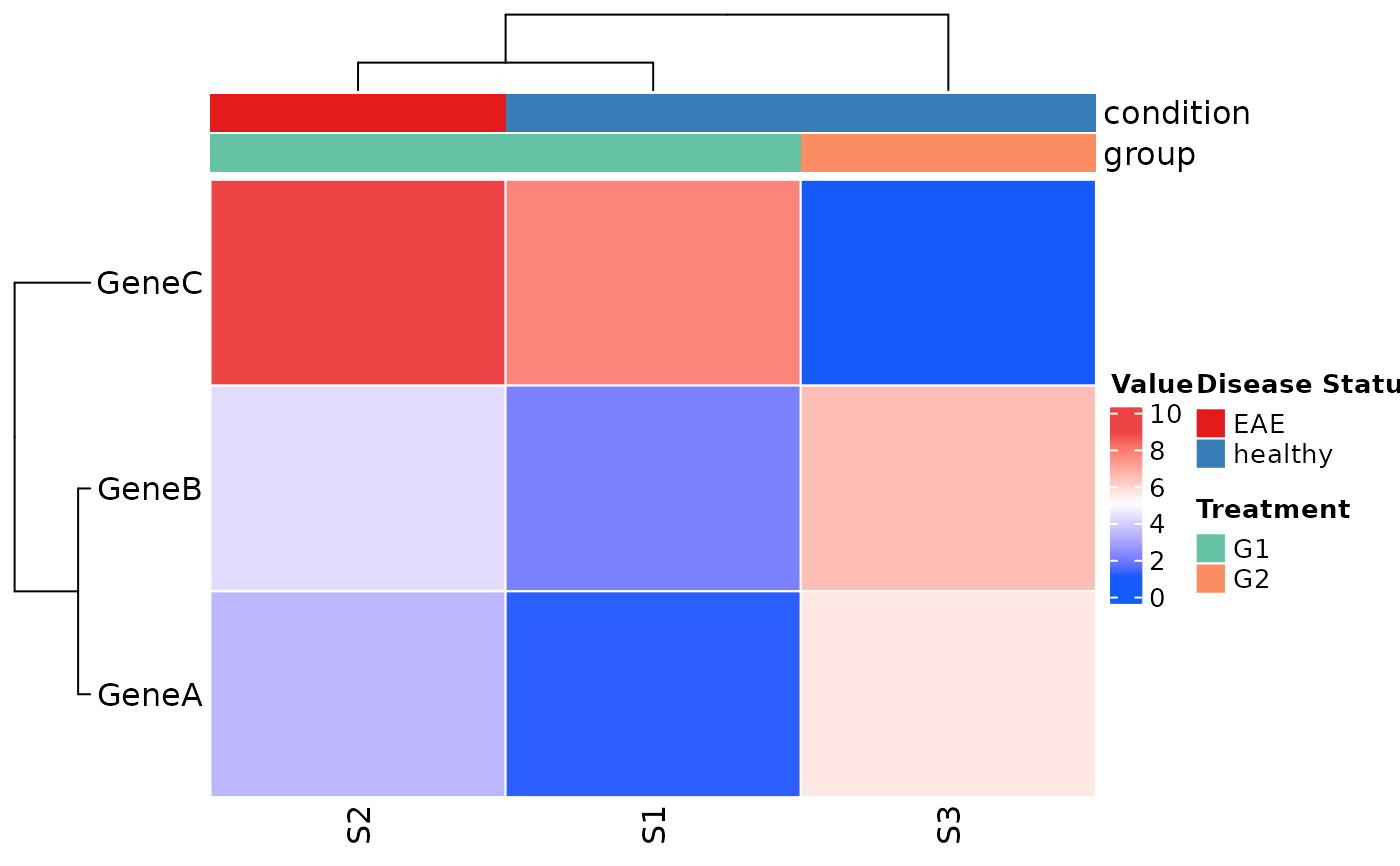
 ### Customize annotation legend titles
plot_heatmap(
df = ex_data_heatmap,
row_var = external_gene_name,
col_var = sample,
value_var = expression,
col_covariates = c("condition", "group"),
annotation_legend_param = list(
condition = list(title = "Disease Status"),
group = list(title = "Treatment")
)
)
### Customize annotation legend titles
plot_heatmap(
df = ex_data_heatmap,
row_var = external_gene_name,
col_var = sample,
value_var = expression,
col_covariates = c("condition", "group"),
annotation_legend_param = list(
condition = list(title = "Disease Status"),
group = list(title = "Treatment")
)
)