Create a dotmap showing effect size (dot size & color) and p-value (tile fill)
Source:R/plot_dotmap.R
plot_dotmap.RdA combined tile + point "dotmap" that visualizes an effect (size and direction) and a p-value (tile fill). The function returns a ggplot object or a patchwork composition when a combined p-value barplot is requested.
Usage
plot_dotmap(
  data,
  x,
  y,
  effect,
  p,
  q = NULL,
  dot_size_vals = c(-2, -1, -0.5, -0.25, 0.25, 0.5, 1, 2),
  dot_size_labels = as.character(dot_size_vals),
  dot_range = c(5, 30),
  palette = c(positive = "darkorange1", negative = "dodgerblue2"),
  xlab_angle = 0,
  mlog10_transform_pvalue = TRUE,
  fill_limits = NULL,
  legend_pvalue_title = NULL,
  legend_dotsize_title = expression(bold("Effect size")),
  legend_bar_type = "Bar type",
  add_combined_pvalue_barplot = FALSE,
  combine_pvalue_method = c("fisher", "CMC", "MCM", "cauchy", "minp_bonferroni"),
  sort_by_pvalue = TRUE,
  only_show_top_sig = NULL,
  also_show_qvalue = TRUE,
  ...,
  patchwork_widths = c(3, 1),
  legend_position = "right"
)
Arguments
- data
data.frame or tibble containing the plotting variables
- x
Character; name of variable in
datato use for x-axis/columns- y
Character; name of variable in
datato use for y-axis/rows- effect
Character; column name of numeric variable in
datato use for dot size and color (direction)- p
Character; column name of numeric variable in
datato use for tile fill (p-value) and for computing the combined p-value barplot (always).NAvalues are allowed; the corresponding tile is drawn withna.valuefill and, whenadd_combined_pvalue_barplot = TRUE, rows where all p-values areNAreceive no bar in the combined p-value panel.- q
Character or NULL; optional column name of a numeric variable in
datato use for tile fill instead ofp. Useful when you want cell shading to reflect q-values (e.g. FDR-adjusted per-cell p-values) while the combined p-value barplot on the right is still computed from the rawpcolumn. WhenNULL(default) the tile fill is determined byp.NAvalues are allowed; the corresponding tile is drawn with the fill scale'sna.value(grey95 by default), exactly as forNAvalues inp.- dot_size_vals
Numeric vector of reference effect values used for the size legend (signed to indicate direction)
- dot_size_labels
Character vector of labels for the size legend; must have same length as
dot_size_vals- dot_range
Numeric(2) range of point sizes (min, max)
- palette
Named character vector with elements "positive" and "negative" specifying dot fill colours for positive/negative effects
- xlab_angle
Numeric angle to rotate x-axis labels (degrees)
- mlog10_transform_pvalue
Logical; when TRUE the fill uses -log10(p) instead of raw p
- fill_limits
Numeric(2) or NULL; limits for the fill scale (c(min, max)). If NULL a sensible default is used (c(0,3) for -log10(p) or c(0,1) for raw p)
- legend_pvalue_title
Character or expression or NULL; override title for the p-value (tile fill) legend. If NULL an automatic title is used.
- legend_dotsize_title
Character or expression; title for the dot-size legend
- legend_bar_type
Character or expression; title for the pvalue bar type legend
- add_combined_pvalue_barplot
Logical; when TRUE (default FALSE) add a combined p-value barplot to the right of the dotmap. When TRUE the function uses the per-row combined p-values (grouped by
y) to build a second panel; thepatchworkpackage is required when using this feature.- combine_pvalue_method
Character; method for combining p-values in the barplot. One of: "CMC", "fisher", "MCM", "cauchy", "minp_bonferroni". Defaults to "fisher". See
combine_pvaluesfor details.- sort_by_pvalue
Logical; when TRUE (default) rows (levels of
y) are sorted by the combined p-value (ascending). Requires p-values present per group.- only_show_top_sig
Numeric(1) or NULL; when adding the combined p-value barplot, if this is a positive integer then only the top X most significant rows by combined p-value are shown (default NULL, show all)
- also_show_qvalue
Logical; when TRUE (default) the combined p-value barplot also displays q-value bars (BH-adjusted combined p-values) in addition to p-value bars. When
custom_qvaluesis supplied via..., those values are used instead.- ...
Additional arguments passed on to
plot_pvalue_barplot()whenadd_combined_pvalue_barplot = TRUE. The following arguments are set internally and will be ignored if supplied here:data,x,y,fill,show_y_labels.custom_qvaluesreceives special handling: if supplied, it must be a column name present indatacontaining one pre-computed combined q-value perylevel (repeated across rows is fine); those values are joined into the internal combined-p data frame and forwarded toplot_pvalue_barplot(). When not supplied, BH-adjusted q-values are computed from the internally combined p-values and used for the barplot.- patchwork_widths
Numeric(2); widths passed to patchwork::
wrap_plots()when adding the combined p-value barplot (default c(3, 1))- legend_position
character(1) Position of the legend (default
"right"). Passed toggplot2::theme(legend.position = ...). Common values include"right","left","top","bottom", or"none"to hide the legend.
Value
A ggplot2::ggplot object when add_combined_pvalue_barplot = FALSE,
or a patchwork composition object (from patchwork) when
add_combined_pvalue_barplot = TRUE.
Details
The tile fill encodes p-values (optionally transformed as -log10(p)), while
the overplotted points encode effect size (size) and direction (fill color).
NA values for effect are marked with an "×" symbol. When a combined
p-value barplot is requested the function groups by y and computes the
combined p-value using combine_pvalues(); the combined panel is aligned
vertically with the main dotmap.
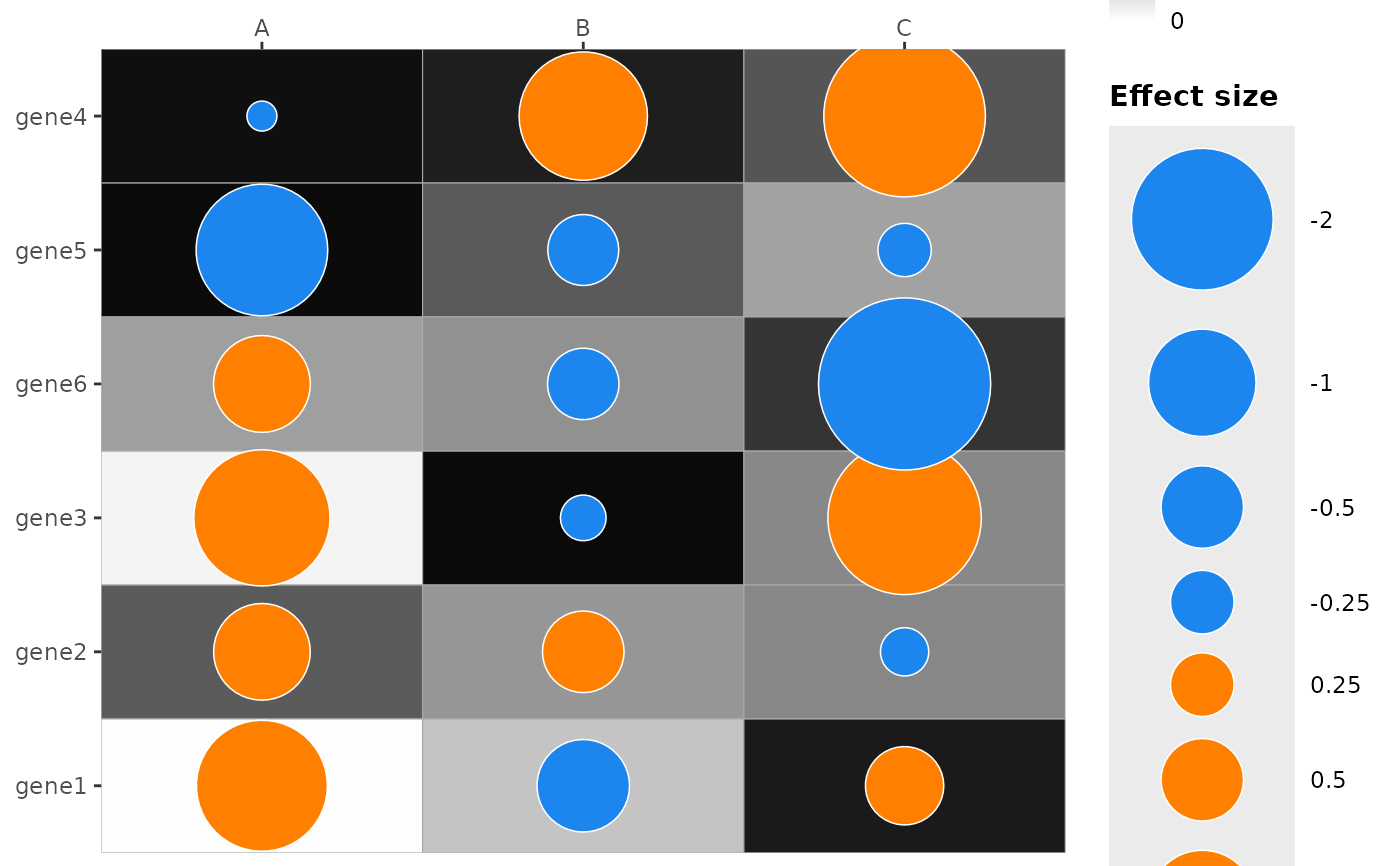
Examples
ggplot2::theme_set(theme_bw2())
set.seed(42)
genes <- paste0("gene", 1:6)
df <- expand.grid(col = c("A", "B", "C"), row = genes, stringsAsFactors = FALSE)
df$effect <- rnorm(nrow(df), mean = 0, sd = 1.2) # realistic effect sizes
df$mlog10_p <- runif(nrow(df), min = 0, max = 3) # -log10(p) between 0 and 3
df$p <- 10^(-df$mlog10_p)
df$row <- factor(df$row, levels = rev(genes))
plot_dotmap(df, x = "col", y = "row", effect = "effect", p = "p",
mlog10_transform_pvalue = TRUE)
#> Scale for size is already present.
#> Adding another scale for size, which will replace the existing scale.
#> Scale for y is already present.
#> Adding another scale for y, which will replace the existing scale.
#> Warning: No shared levels found between `names(values)` of the manual scale and the
#> data's shape values.
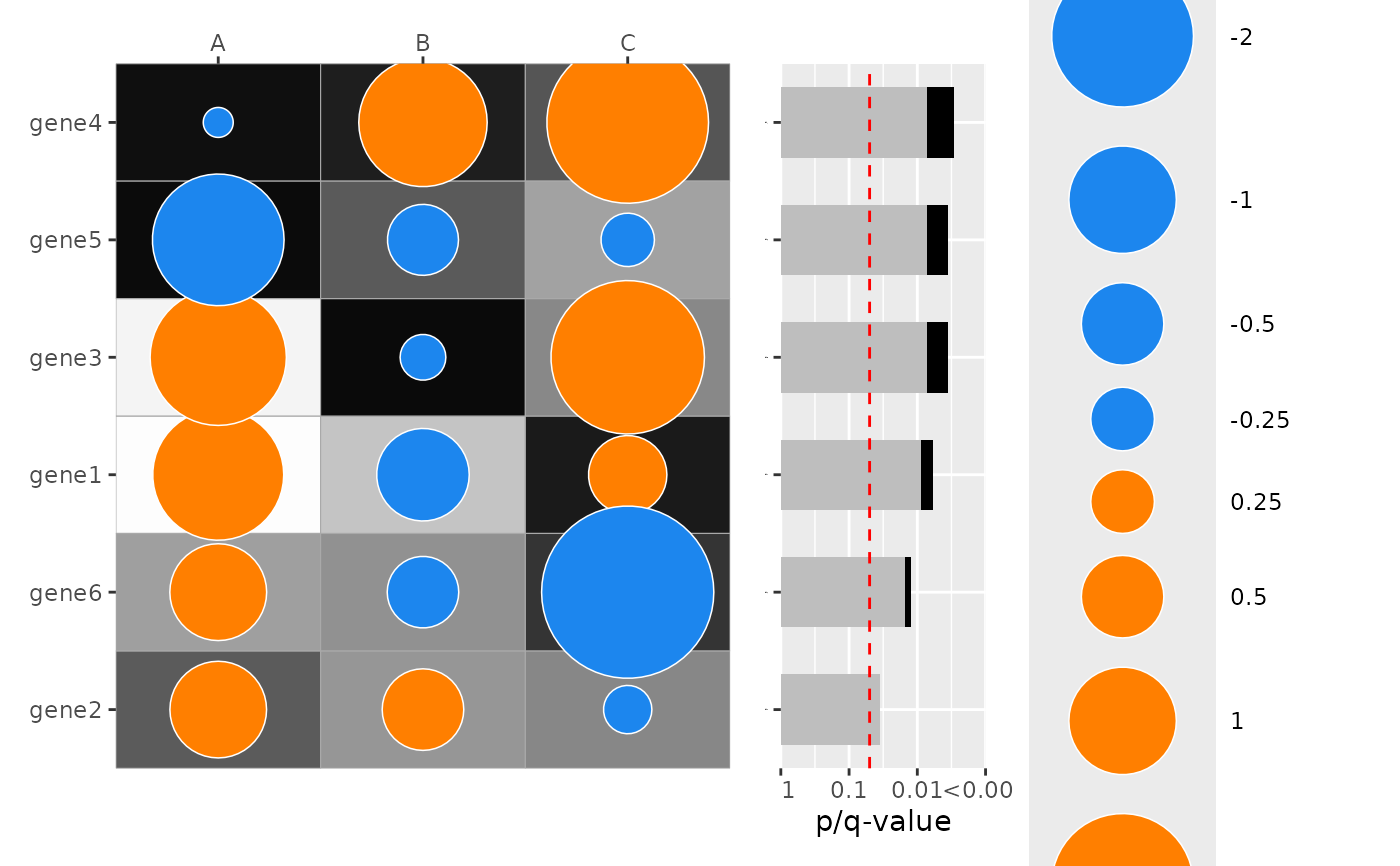
 # Add Fisher's combination pvalue barplot on the right which combines p-values across columns for each row category
plot_dotmap(
df,
x = "col",
y = "row",
effect = "effect",
p = "p",
mlog10_transform_pvalue = TRUE,
add_combined_pvalue_barplot = TRUE,
combine_pvalue_method = "CMC"
)
#> Scale for size is already present.
#> Adding another scale for size, which will replace the existing scale.
#> Scale for y is already present.
#> Adding another scale for y, which will replace the existing scale.
#> Scale for y is already present.
#> Adding another scale for y, which will replace the existing scale.
#> Warning: No shared levels found between `names(values)` of the manual scale and the
#> data's shape values.
# Add Fisher's combination pvalue barplot on the right which combines p-values across columns for each row category
plot_dotmap(
df,
x = "col",
y = "row",
effect = "effect",
p = "p",
mlog10_transform_pvalue = TRUE,
add_combined_pvalue_barplot = TRUE,
combine_pvalue_method = "CMC"
)
#> Scale for size is already present.
#> Adding another scale for size, which will replace the existing scale.
#> Scale for y is already present.
#> Adding another scale for y, which will replace the existing scale.
#> Scale for y is already present.
#> Adding another scale for y, which will replace the existing scale.
#> Warning: No shared levels found between `names(values)` of the manual scale and the
#> data's shape values.
 # --- custom_qvalues: supply your own combined q-values to the barplot ---
# By default the right-side barplot computes combined p-values internally
# (via combine_pvalue_method) and then BH-adjusts them for the q-value bars.
# Use custom_qvalues when you have already computed combined q-values outside
# plot_dotmap (e.g. using a different multiple-testing method, or sharing a
# consistent correction across several plots) and want the barplot to display
# those exact values rather than re-deriving them.
#
# A common use case is when you pre-compute qvalues for tons of tests (too many to plot visually)
# and you want to use the dotmap just for a small subset of those tests but still have the barplot reflect the same q-values that you have already computed for all tests.
# In that case you can pass the pre-computed q-values via a column in your original data frame and specify that column name in custom_qvalues
#
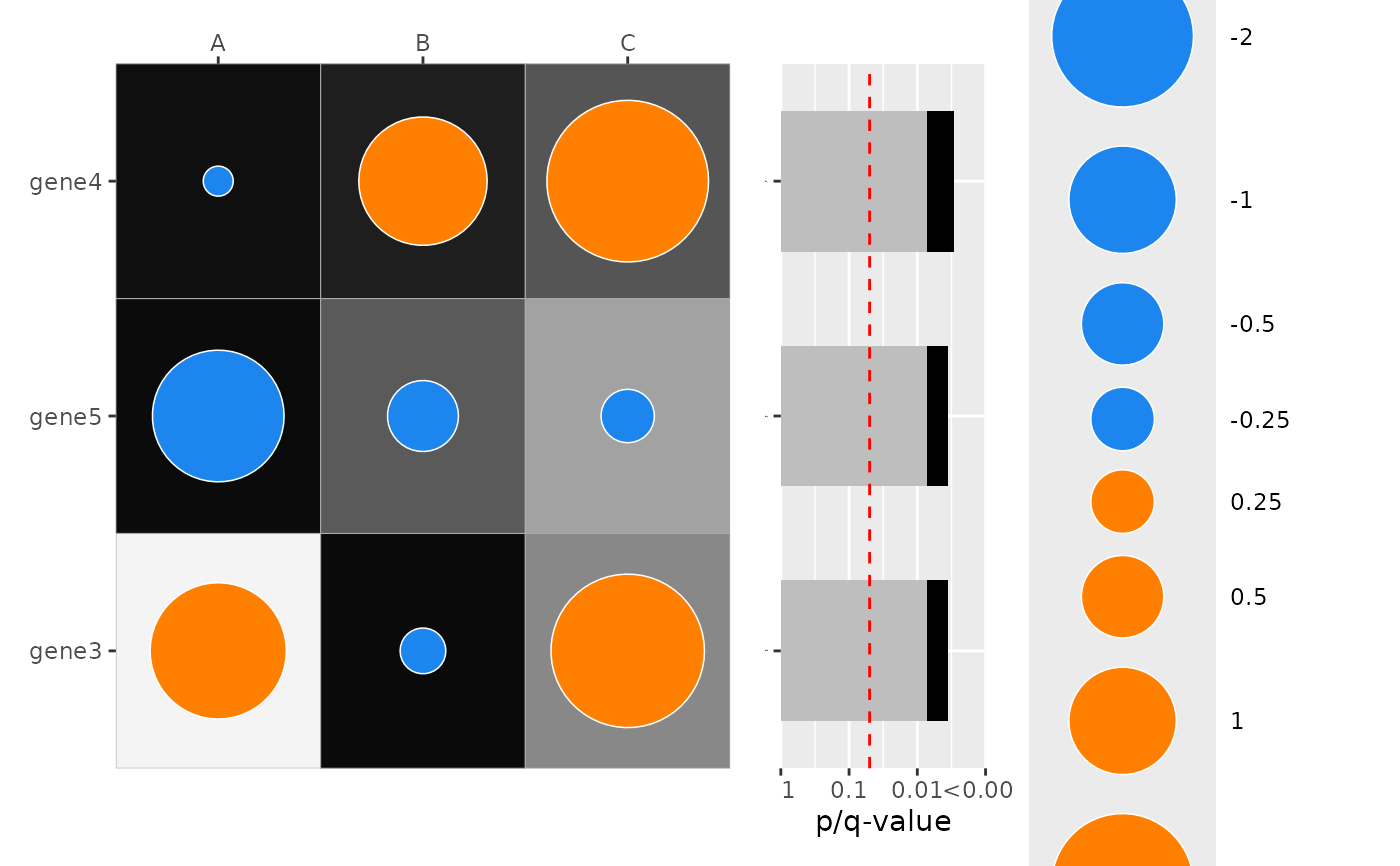
# --- show only top N significant rows in combined barplot ---
# Use `only_show_top_sig` to restrict the combined p-value barplot to the
# top-most significant `y` levels (by combined p-value). Here we show the
# top 3 rows when adding the combined barplot.
plot_dotmap(
df,
x = "col",
y = "row",
effect = "effect",
p = "p",
mlog10_transform_pvalue = TRUE,
add_combined_pvalue_barplot = TRUE,
combine_pvalue_method = "CMC",
only_show_top_sig = 3
)
#> Scale for size is already present.
#> Adding another scale for size, which will replace the existing scale.
#> Scale for y is already present.
#> Adding another scale for y, which will replace the existing scale.
#> Scale for y is already present.
#> Adding another scale for y, which will replace the existing scale.
#> Warning: No shared levels found between `names(values)` of the manual scale and the
#> data's shape values.
#> Warning: Removed 9 rows containing missing values or values outside the scale range
#> (`geom_tile()`).
# --- custom_qvalues: supply your own combined q-values to the barplot ---
# By default the right-side barplot computes combined p-values internally
# (via combine_pvalue_method) and then BH-adjusts them for the q-value bars.
# Use custom_qvalues when you have already computed combined q-values outside
# plot_dotmap (e.g. using a different multiple-testing method, or sharing a
# consistent correction across several plots) and want the barplot to display
# those exact values rather than re-deriving them.
#
# A common use case is when you pre-compute qvalues for tons of tests (too many to plot visually)
# and you want to use the dotmap just for a small subset of those tests but still have the barplot reflect the same q-values that you have already computed for all tests.
# In that case you can pass the pre-computed q-values via a column in your original data frame and specify that column name in custom_qvalues
#
# --- show only top N significant rows in combined barplot ---
# Use `only_show_top_sig` to restrict the combined p-value barplot to the
# top-most significant `y` levels (by combined p-value). Here we show the
# top 3 rows when adding the combined barplot.
plot_dotmap(
df,
x = "col",
y = "row",
effect = "effect",
p = "p",
mlog10_transform_pvalue = TRUE,
add_combined_pvalue_barplot = TRUE,
combine_pvalue_method = "CMC",
only_show_top_sig = 3
)
#> Scale for size is already present.
#> Adding another scale for size, which will replace the existing scale.
#> Scale for y is already present.
#> Adding another scale for y, which will replace the existing scale.
#> Scale for y is already present.
#> Adding another scale for y, which will replace the existing scale.
#> Warning: No shared levels found between `names(values)` of the manual scale and the
#> data's shape values.
#> Warning: Removed 9 rows containing missing values or values outside the scale range
#> (`geom_tile()`).
 #
# Move legend to the left side
plot_dotmap(
df,
x = "col", y = "row", effect = "effect", p = "p",
mlog10_transform_pvalue = TRUE,
add_combined_pvalue_barplot = TRUE,
legend_position = "left"
)
#> Scale for size is already present.
#> Adding another scale for size, which will replace the existing scale.
#> Scale for y is already present.
#> Adding another scale for y, which will replace the existing scale.
#> Scale for y is already present.
#> Adding another scale for y, which will replace the existing scale.
#> Warning: No shared levels found between `names(values)` of the manual scale and the
#> data's shape values.
#
# Move legend to the left side
plot_dotmap(
df,
x = "col", y = "row", effect = "effect", p = "p",
mlog10_transform_pvalue = TRUE,
add_combined_pvalue_barplot = TRUE,
legend_position = "left"
)
#> Scale for size is already present.
#> Adding another scale for size, which will replace the existing scale.
#> Scale for y is already present.
#> Adding another scale for y, which will replace the existing scale.
#> Scale for y is already present.
#> Adding another scale for y, which will replace the existing scale.
#> Warning: No shared levels found between `names(values)` of the manual scale and the
#> data's shape values.
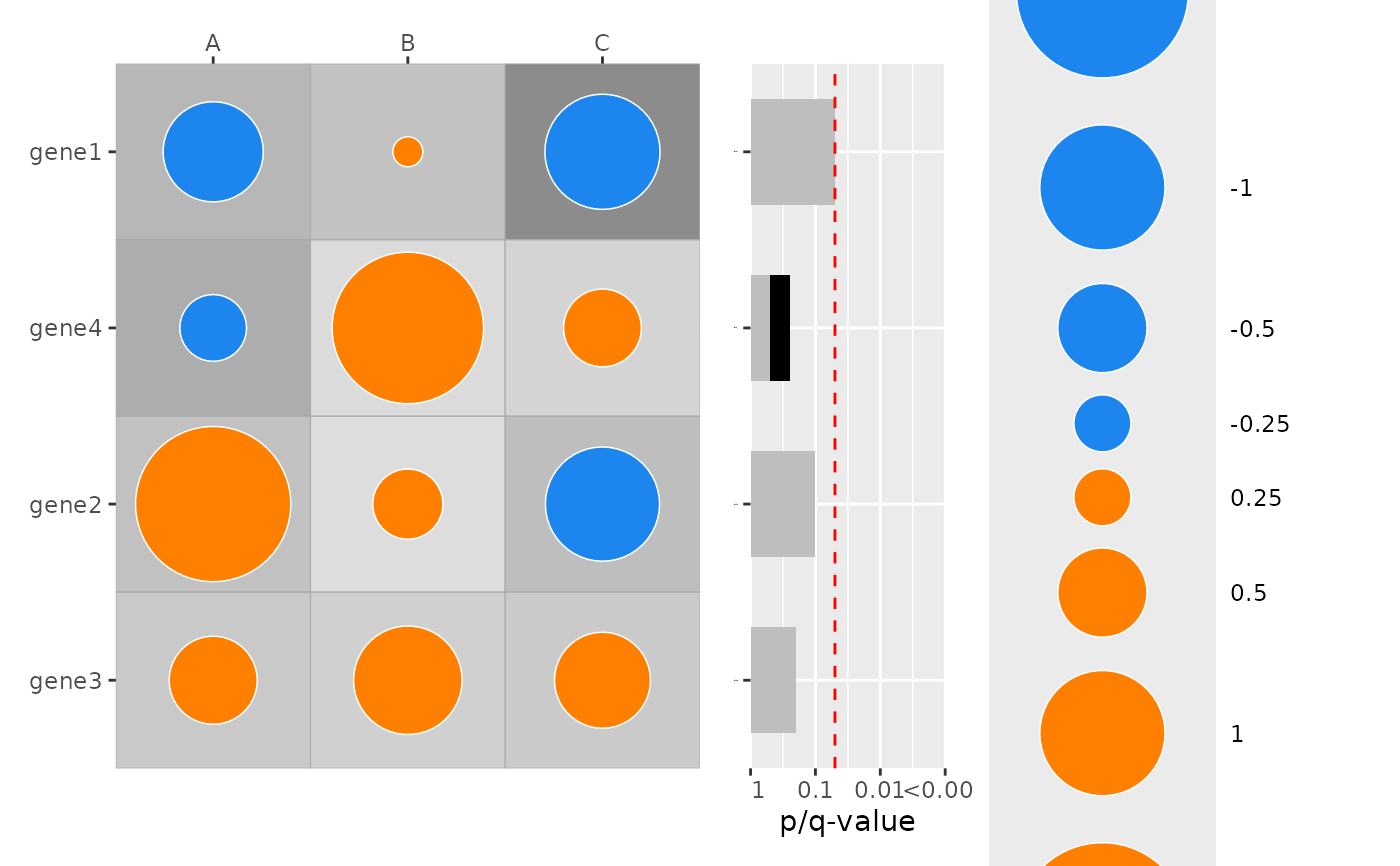 #
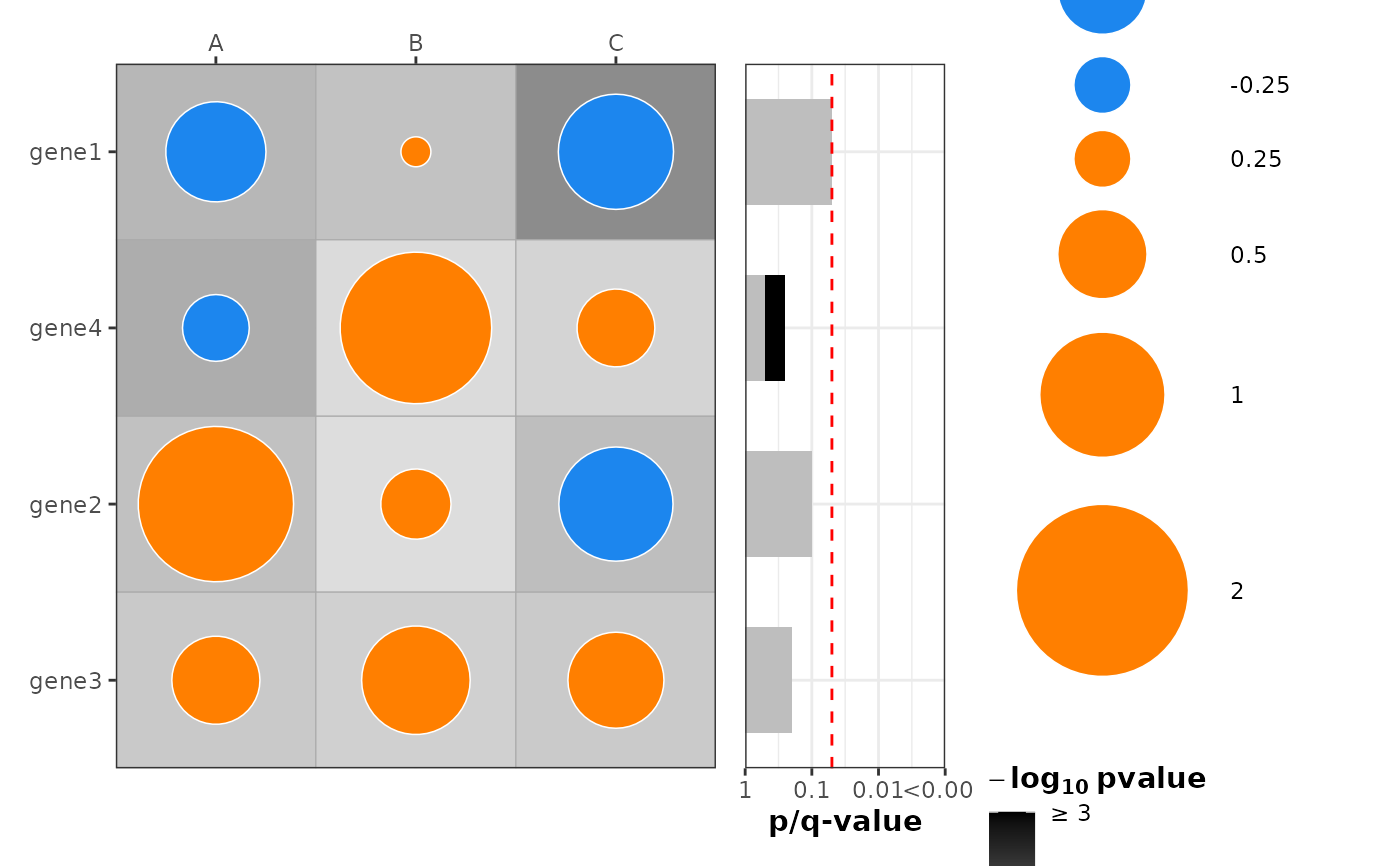
### Simulate example dataset:
set.seed(1)
genes2 <- paste0("gene", 1:4)
df2 <- expand.grid(col = c("A", "B", "C"), row = genes2, stringsAsFactors = FALSE)
df2$effect <- rnorm(nrow(df2), sd = 1)
df2$p <- runif(nrow(df2), 0.05, 0.5) # all p-values moderate on purpose
df2$row <- factor(df2$row, levels = rev(genes2))
# Example Pre-computed combined q-values: one value per row category
my_combined_q <- c(gene1 = 0.05, gene2 = 0.1, gene3 = 0.2, gene4 = 0.5)
df2$my_q <- my_combined_q[as.character(df2$row)]
plot_dotmap(
df2,
x = "col", y = "row", effect = "effect", p = "p",
mlog10_transform_pvalue = TRUE,
add_combined_pvalue_barplot = TRUE,
combine_pvalue_method = "fisher",
custom_qvalues = "my_q" # <-- barplot q-bars reflect my_q, not internal BH
)
#> Scale for size is already present.
#> Adding another scale for size, which will replace the existing scale.
#> Scale for y is already present.
#> Adding another scale for y, which will replace the existing scale.
#> Scale for y is already present.
#> Adding another scale for y, which will replace the existing scale.
#> Warning: No shared levels found between `names(values)` of the manual scale and the
#> data's shape values.
#
### Simulate example dataset:
set.seed(1)
genes2 <- paste0("gene", 1:4)
df2 <- expand.grid(col = c("A", "B", "C"), row = genes2, stringsAsFactors = FALSE)
df2$effect <- rnorm(nrow(df2), sd = 1)
df2$p <- runif(nrow(df2), 0.05, 0.5) # all p-values moderate on purpose
df2$row <- factor(df2$row, levels = rev(genes2))
# Example Pre-computed combined q-values: one value per row category
my_combined_q <- c(gene1 = 0.05, gene2 = 0.1, gene3 = 0.2, gene4 = 0.5)
df2$my_q <- my_combined_q[as.character(df2$row)]
plot_dotmap(
df2,
x = "col", y = "row", effect = "effect", p = "p",
mlog10_transform_pvalue = TRUE,
add_combined_pvalue_barplot = TRUE,
combine_pvalue_method = "fisher",
custom_qvalues = "my_q" # <-- barplot q-bars reflect my_q, not internal BH
)
#> Scale for size is already present.
#> Adding another scale for size, which will replace the existing scale.
#> Scale for y is already present.
#> Adding another scale for y, which will replace the existing scale.
#> Scale for y is already present.
#> Adding another scale for y, which will replace the existing scale.
#> Warning: No shared levels found between `names(values)` of the manual scale and the
#> data's shape values.