Create a grouped bar plot (geom_col) from a data frame. Reorders factor levels of
xvar by yvar (descending) and maps fill to xvar. Accepts a named or unnamed
color vector; unnamed vectors must match the number of groups.
Usage
plot_bars(
  dat,
  yvar,
  xvar,
  colors = NULL,
  sort = c("desc", "asc", "none"),
  title = NULL,
  xvar_label = NULL,
  yvar_label = NULL,
  show_legend = FALSE
)
Arguments
- dat
A data.frame containing the data to plot.
- yvar
Character. Name of the numeric outcome column.
- xvar
Character. Name of the grouping column (will be coerced/reordered as a factor).
- colors
Optional character vector of fill colours. If named, names should match group levels. If unnamed, its length must equal the number of groups. Missing group names are filled with "black".
- sort
Character. How to sort the bars: "desc" for descending, "asc" for ascending, or "none" for no reordering.
- title
Optional plot title
- xvar_label
Optional character label for x variable. If NULL the label is obtained using labelled::get_variable_labels().
- yvar_label
Optional character label for y variable. If NULL the label is obtained using labelled::get_variable_labels().
- show_legend
Logical. Whether to show the legend for fill colors. Default is FALSE.
Examples
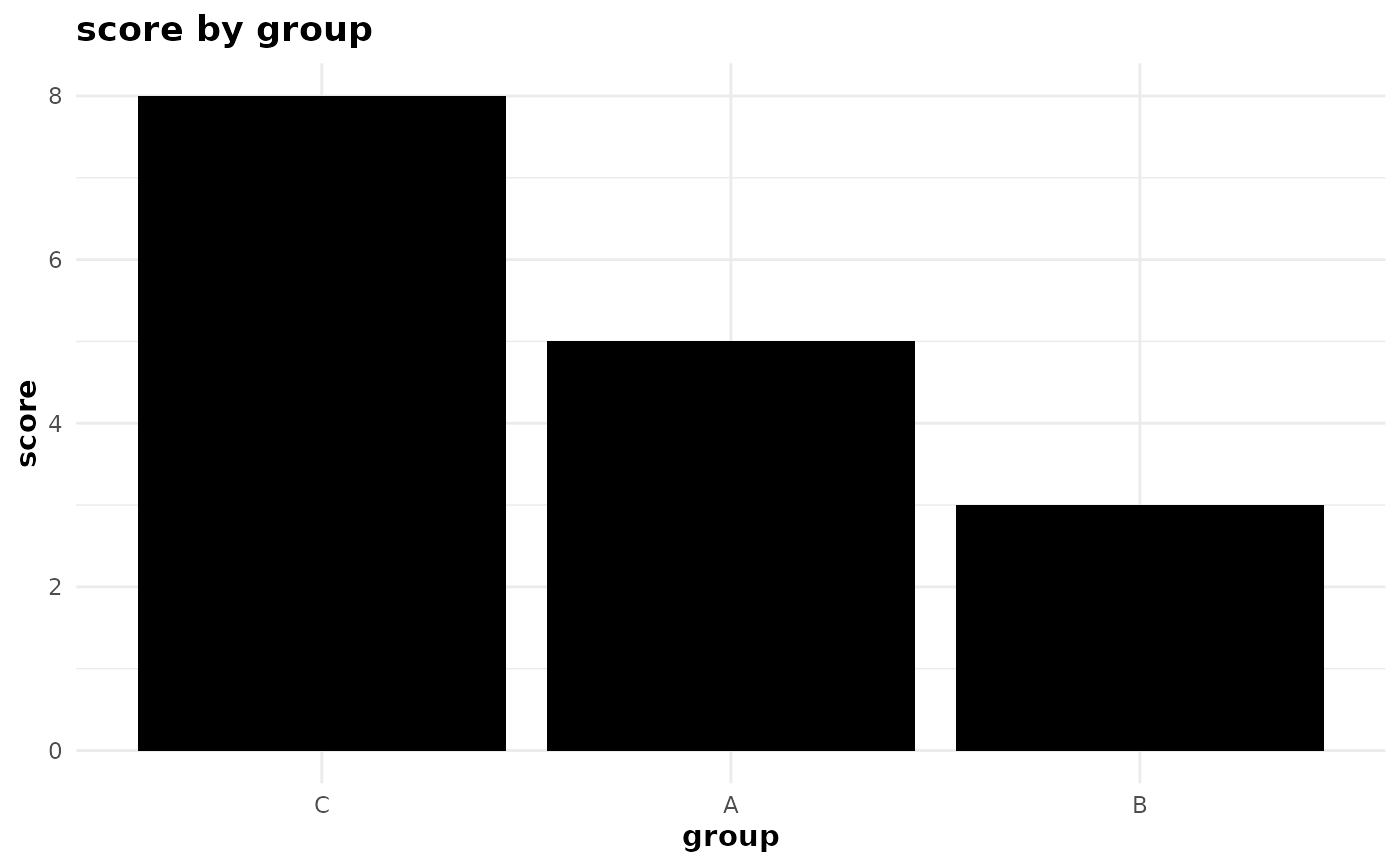
ggplot2::theme_set(theme_bw2())
dat <- data.frame(group = c("A", "B", "C"), score = c(5, 3, 8))
plot_bars(dat, yvar = "score", xvar = "group", sort = "desc")