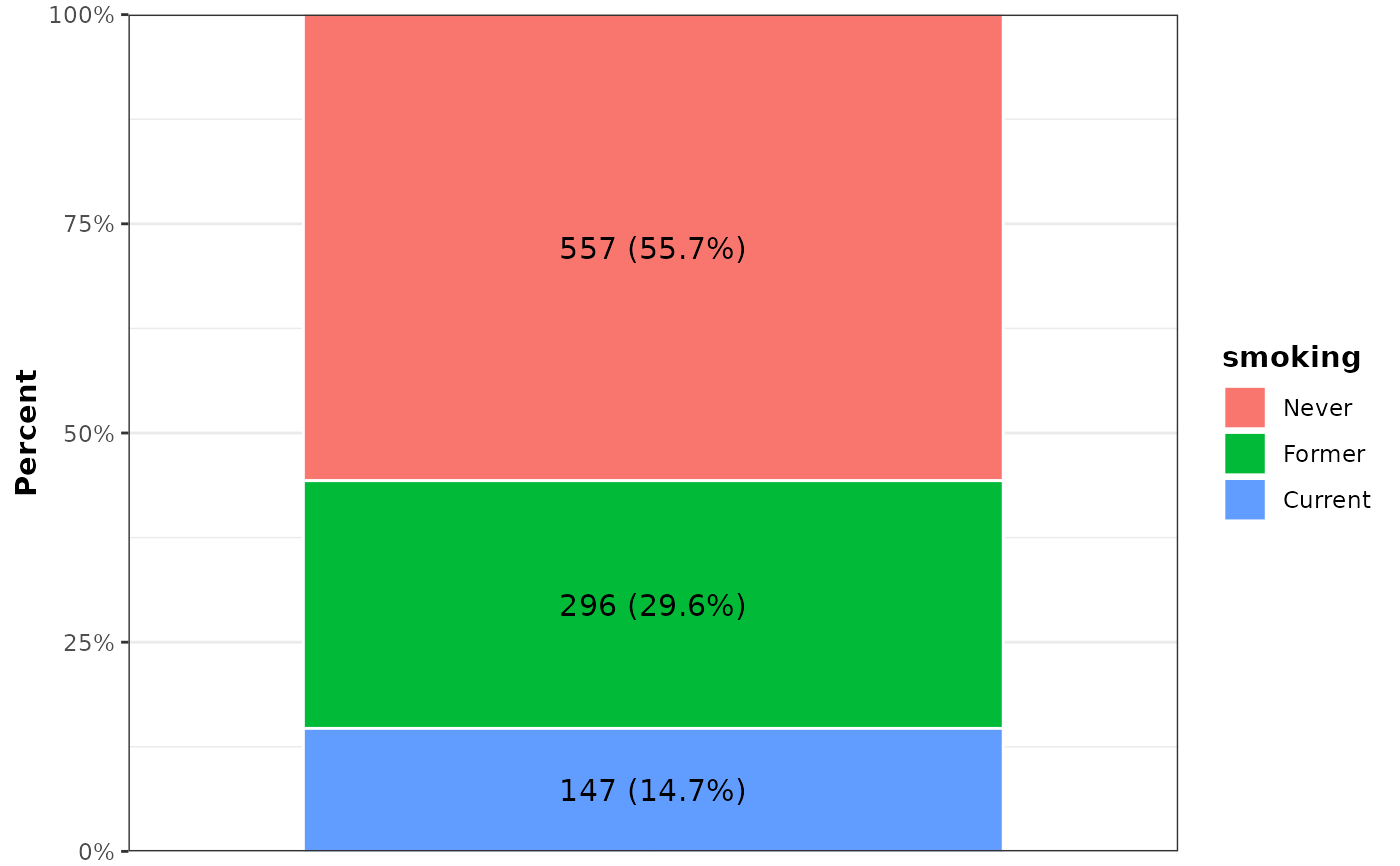
Plot Distribution of a Categorical Variable as a Stacked Bar
Source:R/plot_1_categorical_var.R
plot_1_categorical_var.RdCreate a single 100% stacked bar displaying the distribution of a categorical variable.
Usage
plot_1_categorical_var(
  data,
  var,
  text_inside_bars = c("count_and_percent", "none", "count", "percent"),
  fill_palette = NULL,
  bar_width = 0.8,
  border_color = "white",
  text_size = 4,
  include_cat_labels = TRUE,
  small_pct_threshold = 0.05
)
Arguments
- data
A data.frame.
- var
A categorical variable in
data.- text_inside_bars
Character specifying labels displayed within bar segments. One of
"count_and_percent","count","percent", or"none".- fill_palette
Optional named vector of fill colors passed to
ggplot2::scale_fill_manual().- bar_width
Width of the stacked bar.
- border_color
Color of borders separating bar segments. Use
NAfor no borders.- text_size
Size of text labels displayed within bar segments.
- include_cat_labels
Logical. If TRUE, display the category name above the count/percent label inside each bar segment. Category names are shown in bold.
- small_pct_threshold
Proportion threshold below which category labels are displayed on a single line to improve readability for small bar segments. Default is 0.05 (5%).